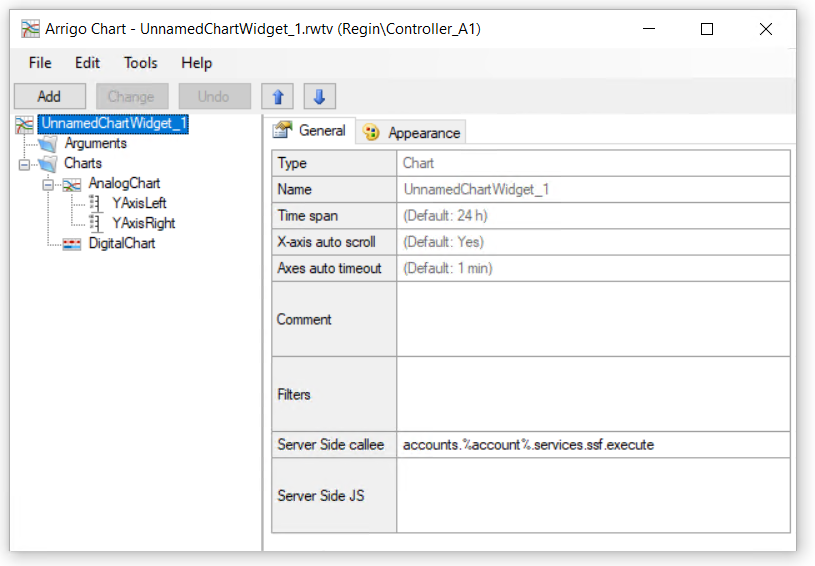
Charts Tool
This tool handles all .rwtv files. These are the trend/chart definition files. All widgets and chart views are loaded from files from this tool.
The .rwtv files are possible to configure in a Widget, and as a view. They can be accessable from dashboard as Widget content, when a Widget is clicked, or as a stand alone Link Icon.
| Name | Description | Default |
|---|---|---|
Name |
The technical name of the chart | Mandatory |
Time Span |
The default initial time span for x-axis domain | 24 h |
X-axis auto scroll |
If No, the x-domain is not following realtime data fetch updates | Yes |
Axes auto timeout |
If scrolled back in time, this is the wait time before auto scroll forward to "Now" (If pause button in UI is pressed, this timer cancels and user needs to click play) | 1 min |
Comment |
Internal helper text for configuration | None |
Filters |
Dynamic filter attribute, see more in Dynamic Filters section. | None |
ServerSide callee |
wamp method called for all filter event updates | accounts.%account%.services.ssf.execute |
Server Side JS |
The SSF attribue, read more about ServerSideFunctions. | None |
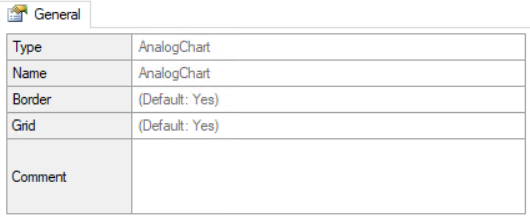
Analog Chart
| Name | Description | Default |
|---|---|---|
Border |
If Yes, a border is displayed around the chart | Yes |
Grid |
If Yes, a grid is displayed in chart as helper grid lines | Yes |
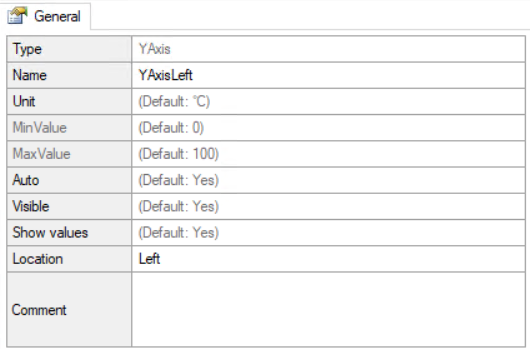
Axis
| Name | Description | Default |
|---|---|---|
Name |
The context local technical name of the signal | Mandatory |
Unit |
Used for automatic matching of signals | degree C |
MinValue |
Axis bottom value | 0 |
MaxValue |
Axis top value | 100 |
Auto |
If Yes, Auto sets the axis range automatic based on the max and min value of all connected signals in the current x axis date range | Yes |
Visible |
Indicates if axis should be visible | Yes |
Show values |
If Yes, axis values are presented next to axis | Yes |
Location |
Left or Right | Left |
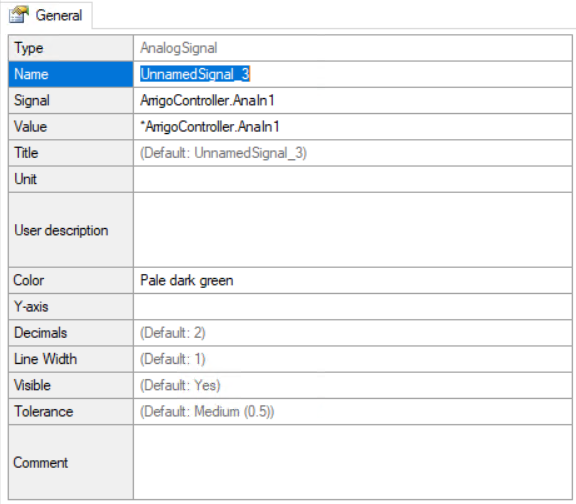
Analog Signal
| Name | Description | Default |
|---|---|---|
Name |
The context local technical name of the signal | Mandatory |
Signal |
The signal name in database, used for fetching historical data | None |
Value |
The bound variable for real time data fetching (Trend) | None |
Title |
The user friendly signal text | Name value |
Unit |
The signals unit | None |
User Description |
User friendly description of signal (for future presentation) | None |
Color |
Signal color in chart | Next available color |
Y-axis |
Which axis the signal is bound to | Auto based on unit |
Decimals |
Number of decimals presented in chart view | 2 |
Line Width |
Not used (future use) | None |
Visible |
If No, the signal is initially hidden | Yes |
Tolerance |
The lower value, the more detailed signal data is presented. A low value on tolerance can trigger heavy fetching of data | Medium (0.5) |
Digital Chart
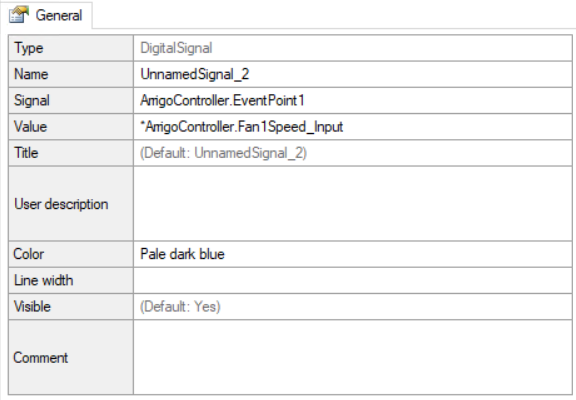
Digital Signal
Alarm Signal
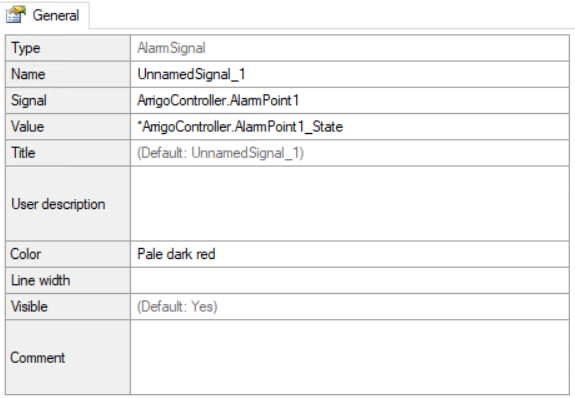
Attributes
| Name | Description | Default |
|---|---|---|
Name |
The context local technical name of the signal | Mandatory |
Signal |
The signal name in database, used for fetching historical data | None |
Value |
The bound variable for real time data fetching (Trend) | None |
Title |
The user friendly caption for signal in views | Name value |
Color |
The signal color | Auto |
Visible |
If No the signal is initially hidden | Yes |
Auto Title for signals
The title of a AnalogSignal, DigitalSignal or AlarmSignal is auto fetched from database if:
- The
Titleis default, or has the value ofNamevalue. - The
Signalattribute is configured for the signal.
Auto Unit for Analog Signals
The Unit (and auto axis selection based on unit) is auto fetched from database if:
- The
Unitis empty. - The
Signalattribute is configured for the signal.
Tolerance
The tolerance number is a factor. The factor indicates how much the signal should be flatten. No min/max values in the x-domain range is lost, only the data between. The lower value, the more data.